Study: Where small businesses are thriving 2026

Written byRobin Saks Frankel

Reviewed by Team Nav

From bakeries to boutiques, small businesses are some of America’s favorite places to shop. As entrepreneurship continues to grow across the U.S., some parts of the country are seeing more growth than others.
We set out to learn where businesses are thriving the most across the country. To do so, we collected data from Gusto’s Real Time Economic Data from November 2023 to October 2025 to better understand how small business owners have fared over the past two years.
We analyzed net hiring percentages to learn more about growth, involuntary termination percentage to gain insight into where layoffs were lowest, and average hourly pay to calculate pay growth. Using these metrics, we calculated a thriving score for 50 metro areas and ranked each accordingly. Read on to learn where small businesses are flourishing.
Key takeaways
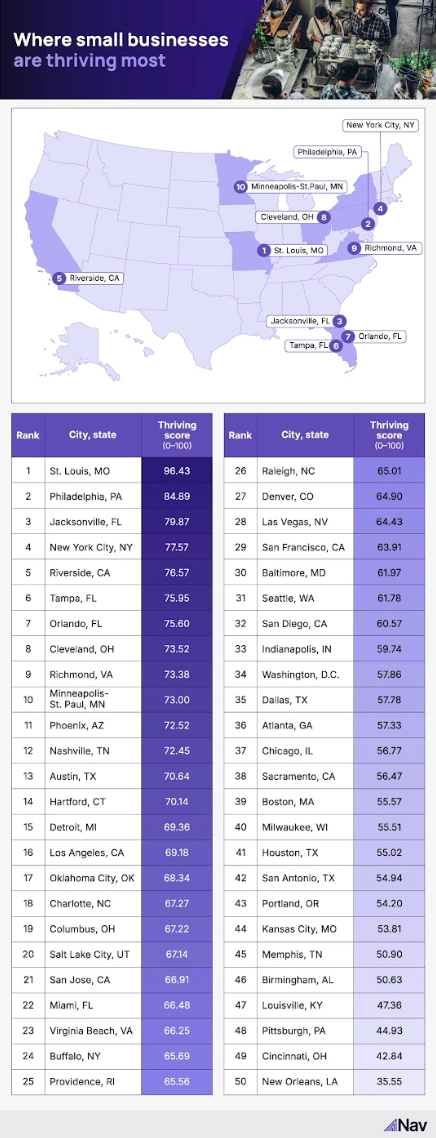
- St. Louis and Philadelphia-based small businesses are thriving the most
- San Jose and greater Minneapolis-St. Paul showed the greatest small business growth during our sample time period
- Las Vegas and Detroit-based small businesses reported the fewest layoffs during our sample time period
- Small businesses across the U.S. reported an average decline of -0.03% in net hiring during our sample time period
- Small businesses across the U.S. reported an average pay growth of 3.02% during our sample time period
- Small business employees in the U.S. earned an average hourly pay of $34.31 during our sample time period
Top cities for small businesses
Starting and maintaining a small business is no small feat. Business owners have to balance growth with stability, from hiring to keep pace with demand and managing inventory to keeping pay rates competitive.
To learn where the data suggests small businesses are balancing growth, retention, and wages effectively, we analyzed three signals that reflect realities owners navigate every day: net hiring percentage, involuntary termination percentage, and average hourly pay. Together, these three metrics show where small businesses are growing, avoiding workforce cuts, and supporting stronger wages.
Leading this charge are businesses in St. Louis, as the city earned an exemplary score of 96.43 out of 100. From November 2023 to October 2025, small businesses in St. Louis saw the highest pay growth at 13.48%, contributing to the city’s number one ranking overall.
Philadelphia follows with a score of 84.89 out of 100. According to the 2025 Philadelphia Employment Report, job growth in Philadelphia outpaced surrounding collar counties in the state and the broader metro region over the past five years. Overall, we discovered that small businesses in Philadelphia saw the fourth highest growth in our analysis with a net hiring percentage of 0.25% in recent years.
Coming in third place for thriving small businesses is Jacksonville, with a score of 79.87 out of 100. When analyzing hiring data between November 2023 and October 2025, we found that Jacksonville saw its greatest increase in small business hiring in July 2025 with a net hiring percentage of 5.1%.
Overall, small businesses across the U.S. reported an average pay growth of 3.02% from November 2023 to October 2025, based on our calculations. Using the national average hourly pay data reported by Gusto, we calculated the average hourly pay of small business employees for that period was $34.31. The current federal minimum wage is $7.25 per hour.
Where small businesses are growing most
For small business owners, hiring can be a clear sign that demand is strong enough to justify growth. Bringing on new employees often means a business has more customers to serve, more work to manage, or enough confidence in the local market to invest in added labor. That’s why we took a closer look at recent net hiring data to determine where small businesses are experiencing the most growth.
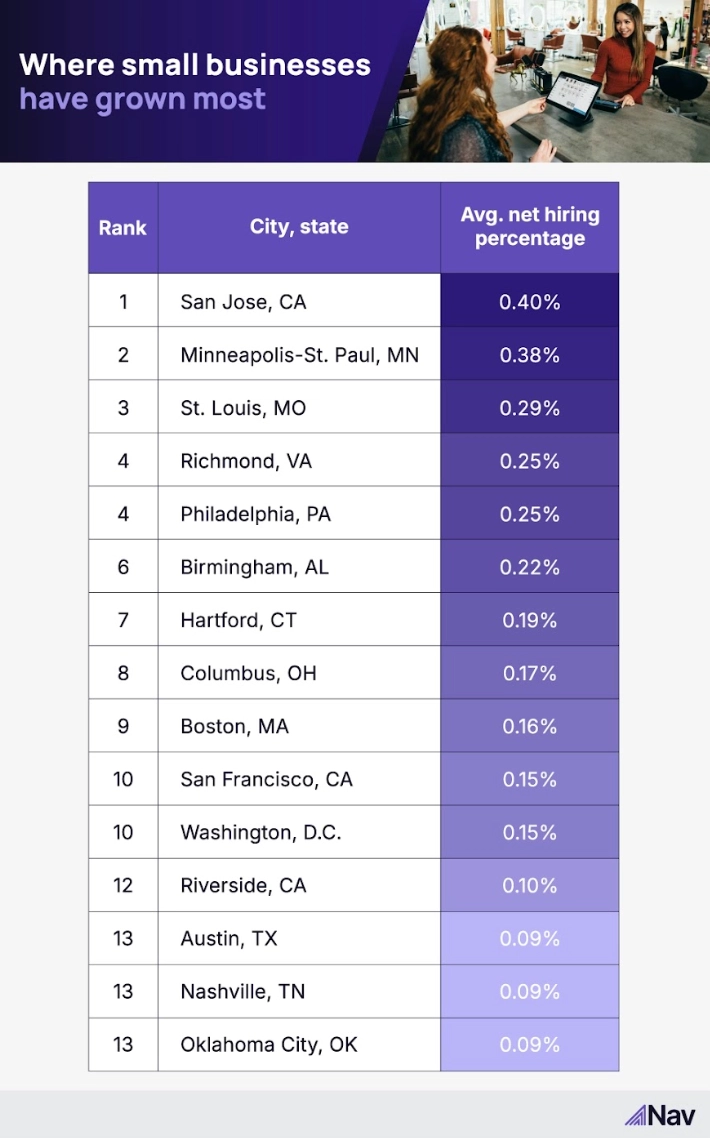
Up first with an average net hiring percentage of 0.40% is San Jose. Since November 2023, San Jose small businesses experienced the most growth in June 2024 (2.20%) and June 2025 (2.10%), indicating a boost in business during summer months.
In second place is Minneapolis-St. Paul, with an average net hiring percentage of 0.38% between November 2023 and October 2025. Throughout this time period, Minneapolis saw the most growth in small business hiring in August 2025 at 2.10%.
St. Louis (0.29%) follows in third place. Richmond and Philadelphia tied for fourth place with an average net hiring percentage of 0.25%. On the opposite end of the spectrum, Memphis and Las Vegas small businesses reported the least growth in recent years with an average net hiring percentage of -0.43% and -0.36%, respectively.
Grow your business with Nav
Starting a business can be a difficult but rewarding journey. Ensuring financial stability is important for longevity as a small business owner. Credit and cash flow are key indicators for your business’s current stability and your potential for funding when you’re trying to grow.
Every lender is different, and each bureau calculates credit scores differently. Nav helps you turn your credit and cash flow data into clear next steps for your business to help you prepare for funding opportunities.
Nav Prime helps you track your complete business and personal credit profile, cash flow, and funding readiness in real-time. You can learn what matters most to help improve your chances of approval for loans, credit cards, or trade credit — before you apply. With select plans, you can unlock additional tools to help you build business credit and strengthen your eligibility.
Methodology
In this study, we analyzed Gusto’s Real Time Economic Data from November 2023 to October 2025 to learn where small businesses are thriving in the U.S. based on hiring growth, percentage of layoffs, and pay growth.
We collected monthly data for each statistic and calculated the average net hiring percentage, average involuntary termination percentage, and average pay growth for small businesses over the past two years. Each metric was normalized to a 0 to 1 scale and combined into a composite thriving score, with net hiring weighted at 40%, involuntary termination weighted at 40%, and pay growth weighted at 20%.